SPY vs UPRO Over 10 Years: What US$200,000 Became
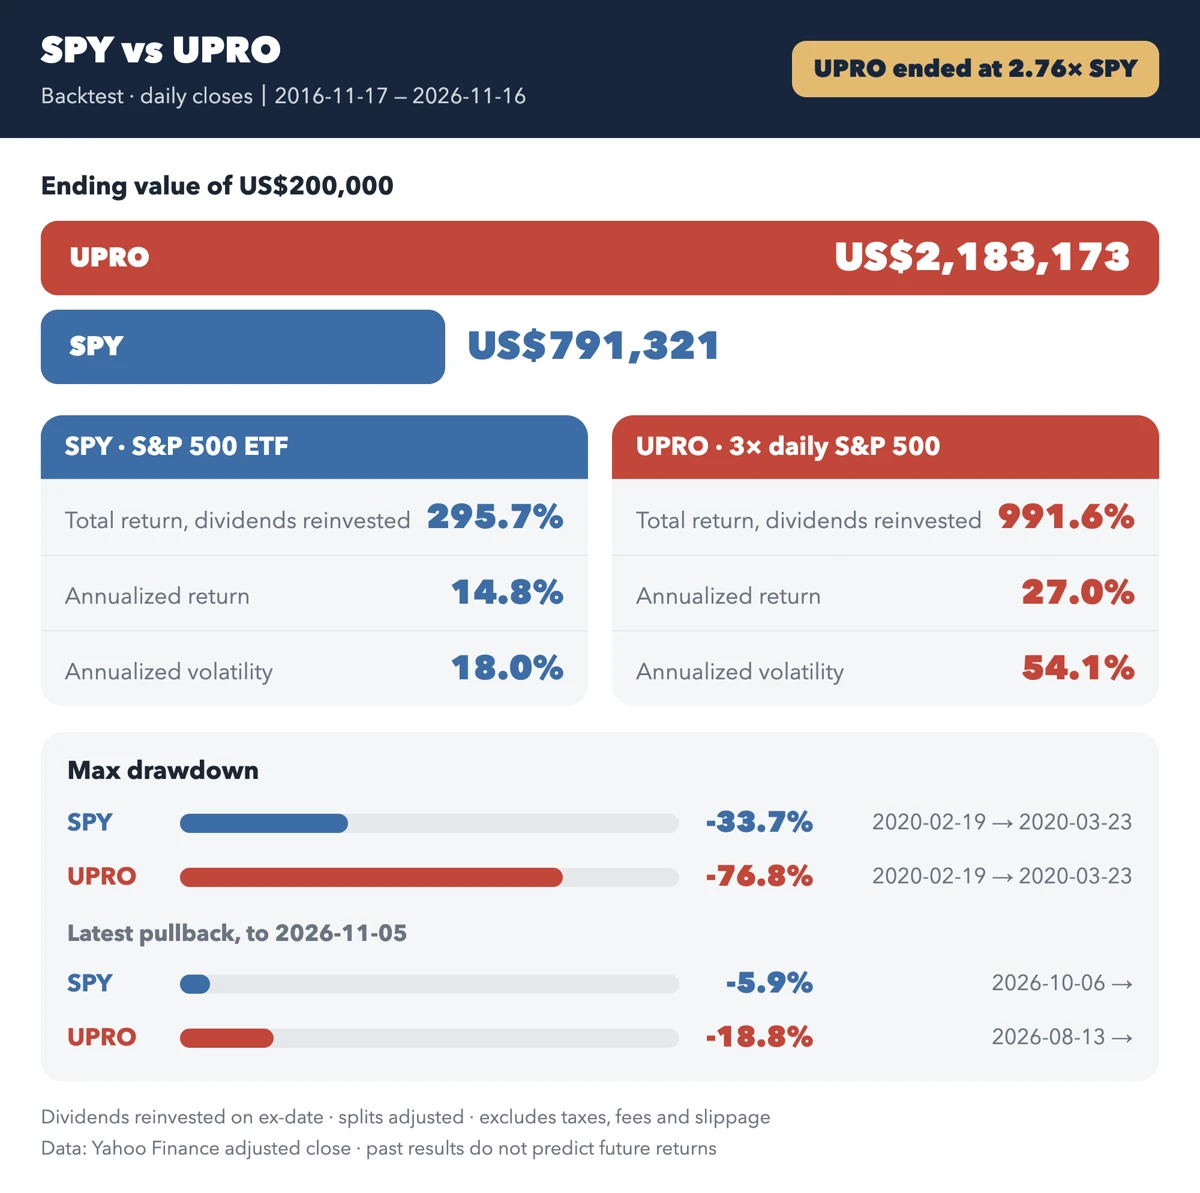
I am long on America, and I hold UPRO, an ETF that aims for three times the daily return of the S&P 500. I wanted to see what that choice looked like over a full decade, so I backtested US$200,000 in SPY and US$200,000 in UPRO, bought at the close on 2016-11-17 and valued at the close on 2026-11-16.
What the numbers say
| Measure | SPY | UPRO |
|---|---|---|
| Ending value of US$200,000 | US$791,321 | US$2,183,173 |
| Total return, dividends reinvested | 295.7% | 991.6% |
| Annualized return | 14.8% | 27.0% |
| Annualized volatility | 18.0% | 54.1% |
| Max drawdown | -33.7% | -76.8% |
UPRO ended at about 2.76 times the value of SPY. It got there with three times SPY's volatility and a max drawdown more than twice as deep, because the leverage resets every day and losses compound as hard as gains.
The data is Yahoo Finance's adjusted close, with dividends reinvested on the ex-date and UPRO's 3-for-1 split in 2018 and 2-for-1 split in 2022 adjusted. Taxes, fees and slippage are not included, and a past backtest does not tell you what the next ten years will return.
The price of the higher ending value
UPRO fell by roughly half or more four times in these ten years:
| Drop | SPY | UPRO | UPRO recovered |
|---|---|---|---|
| Sep–Dec 2018 | -19.3% | -50.3% | Jul 2019 |
| Feb–Mar 2020 | -33.7% | -76.8% | Jan 2021 |
| Jan–Oct 2022 | -24.5% | -63.9% | Jun 2024 |
| Feb–Apr 2025 | -18.8% | -48.9% | Jul 2025 |
Each drop is measured from the previous closing high to the lowest close, and "recovered" is the first close back at that high.
In March 2020, three-quarters of the account was gone in about a month. After 2022, it took UPRO two and a half years to get back to where it started that year. The ending value in the first table only belongs to someone who held through all four.
Why I keep buying when it falls
Warren Buffett wrote in his 1986 shareholder letter, and again in a 2008 New York Times op-ed, that he tries to be fearful when others are greedy and greedy when others are fearful. In his 2021 letter he put it more simply: never bet against America.
I took both literally, with three times the leverage. The more UPRO drops, the more I buy. That is the rule I follow with my own money, and the drawdown table above is what following it feels like from the inside.
Life has down months too
Markets are not the only thing that goes up and down. Some months at work are heavy, some weeks at home take everything, and some days nothing gets done. What I can control is small: finish one more task than I did yesterday. I do not compare myself with anyone else, only with my own yesterday.
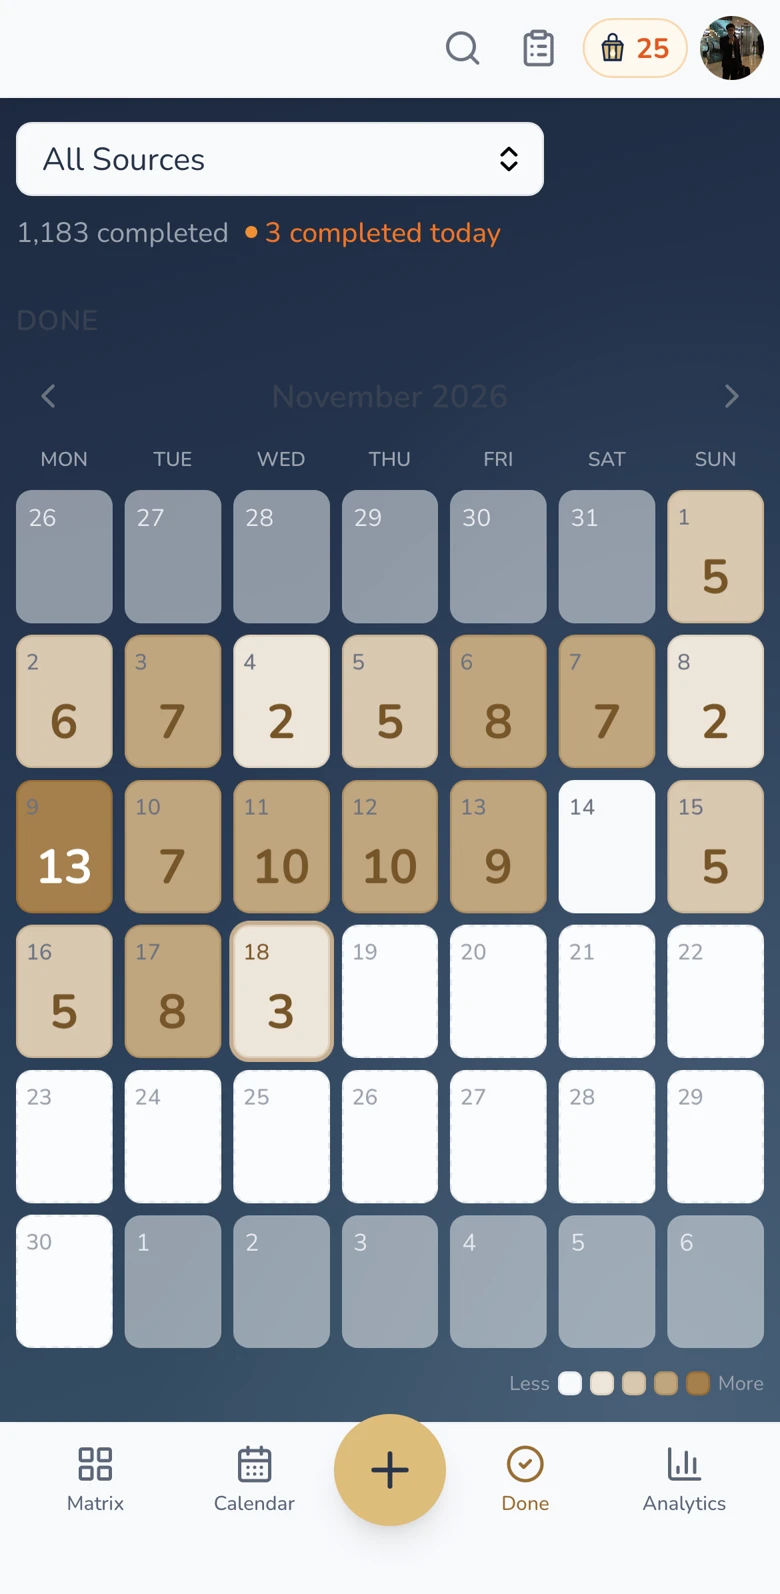
The Done tab in ToDoForce shows every day of the month with the number of tasks I completed. In November 2026 the count moved between 2 and 13 a day, and one day was empty. Looked at one day at a time it is uneven. Looked at as a month, it moves forward.
Missing a day does not end the run
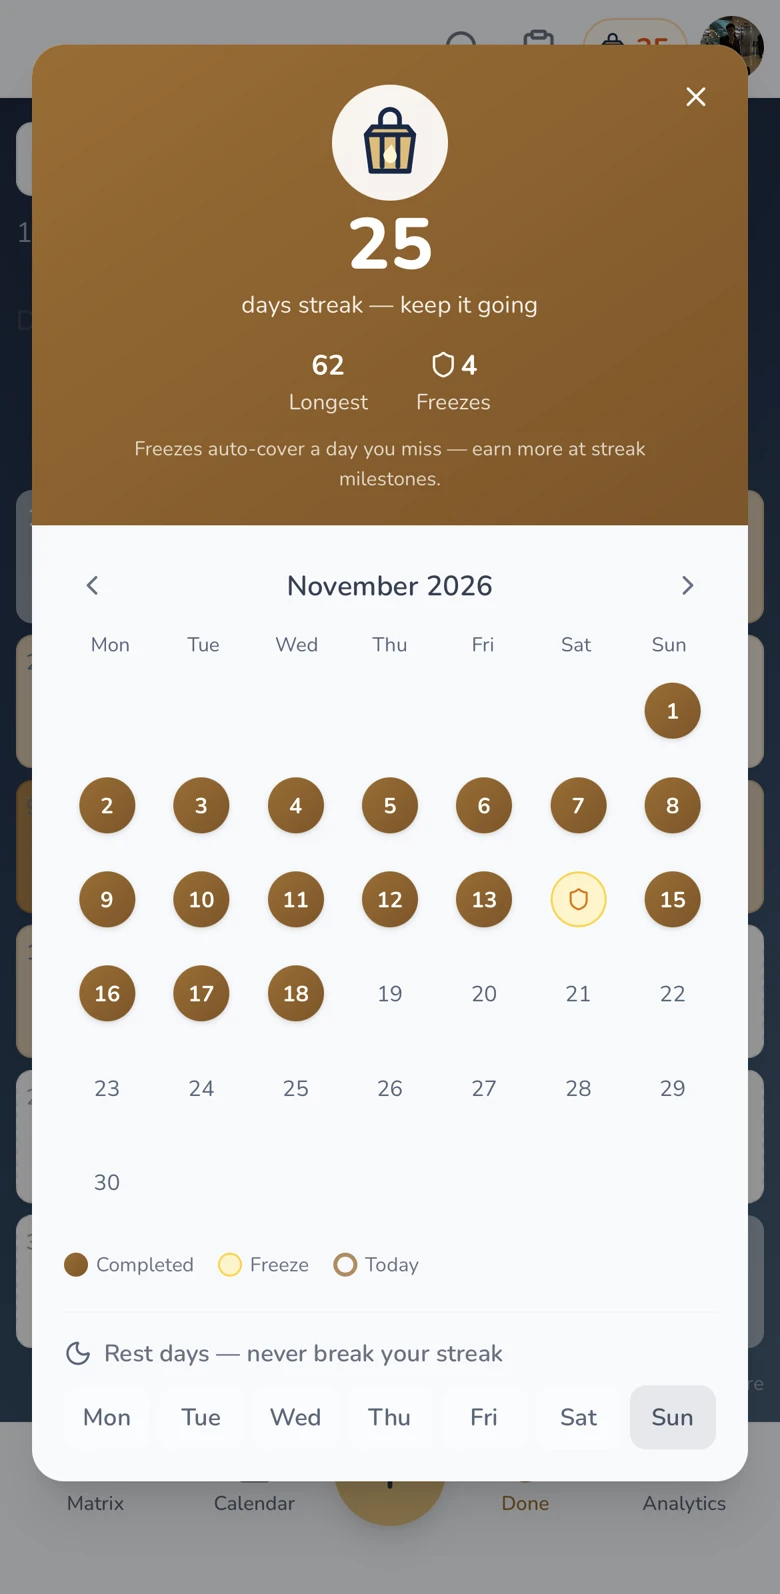
On 2026-11-14 I finished nothing. A streak freeze covered that day, so the streak kept going and reached 25 days, with 62 days as my longest run. One empty day is a dip, not the end of the line, which is the same lesson the UPRO chart teaches over ten years.